Lab#RE03-2: HighCharts
ReactJS labs
📘 React JS Lab#RE03-2: Highcharts
In this lab, we will be using Highcharts React.
It is a library that allows you to integrate Highcharts, a popular JavaScript charting library, into your React applications.
It provides a React component that acts as a wrapper around the Highcharts library, enabling you to create interactive and visually appealing charts.
By utilizing the Highcharts React library, you can easily incorporate interactive charts into your React application, making the data visually accessible and enhancing the user experience.
1 Overview
Here’s a high-level overview of how Highcharts React works to make data visible in a React app:
Installation: First, you need to install theHighchartsReact library along with theHighchartslibrary itself. You can do this using package managers like npm or yarn.Importingthe Components: Once installed, you can import the necessary components from theHighchartsReact library into your React application. The main component you’ll use is typically calledHighchartsReact.Configuration:Highchartscharts require configuration options to define the type of chart, data sources, styling, and various other settings.- In your React component, you’ll create a configuration object that specifies these options.
- You can define the configuration object directly in your component or import it from an external file.
Renderingthe Chart: Within your React component’s render method, you’ll use theHighchartsReact component, passing in the configuration object as a prop.- This component acts as a container for the
Highchartschart and handles the integration with React.
- This component acts as a container for the
Updatingthe Data: To make the chart data visible and dynamic, you’ll typically store the data in the component’s state or props. Whenever the data changes, you can update the state or props accordingly, triggering a re-render of the chart component with the new data.Interactivity and Events:Highchartsprovides various interactive features like tooltips, legends, zooming, and selection.- You can configure these features through the chart’s configuration object and handle events triggered by user interactions, such as clicking on a data point.
Styling and Customization:Highchartsoffers extensive customization options to control the appearance of your charts. You can modify colors, fonts, labels, axes, and other visual elements using the configuration object.- Additionally, you can apply CSS styles to the chart container or
- use
Highcharts-specificAPIs to further customize the chart’s appearance.
Additional Features:Highchartssupports a wide range of chart types, including:- line charts,
- bar charts,
- pie charts,
- area charts,
- radar charts,
- windrose charts,
- stock charts and more.
- You can explore the `
Highchartsdocumentation to learn about additional features, such as exporting charts, adding annotations, or integrating with external data sources.
1.1 References
- Codesanbox example: highcharts
- Codesanbox example: live random data
- Codesanbox example: bitcoin reatime data stock
- HighCharts Demo
1.1.1 Todo
2 Pie Chart
2.1 Importing Dependencies
import React from "react";
import Highcharts from "highcharts/highstock";
import PieChart from "highcharts-react-official";
The code imports the necessary dependencies: React from the “react” package, Highcharts from the “highcharts/highstock” package, and PieChart from the “highcharts-react-official” package. These dependencies are required for using Highcharts with React.
2.2 Defining Data
const grades = [
  {
    name: "Carla",
    y: 135
  },
  {
    name: "Marc",
    y: 89
  },
  {
    name: "Victor",
    y: 44
  },
  {
    name: "Rafa",
    y: 32
  },
  {
    name: "Fabrizio",
    y: 12
  }
];
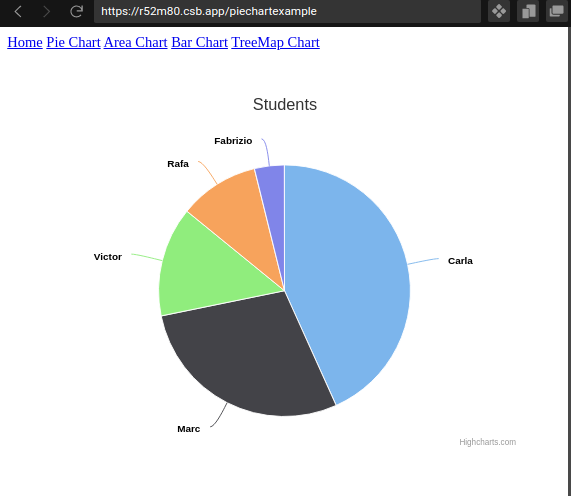
An array called grades representing data points for the pie chart. Each object in the array contains a name and a y value. This data will be used in the chart’s series.
2.3 Chart Configuration
The options object defines the configuration for the pie chart. It includes a title specifying the chart’s title, a chart object specifying the type of chart (in this case, “pie”), and a series array containing the data for the chart. The grades array is assigned to the data property of the series.
2.4 Creating the React Component
A functional component called App is defined. Inside the component’s JSX, a <PieChart> component is rendered, passing in the Highcharts dependency and the options object as props. The component is wrapped in a <div> element with some inline styling to provide a margin.
2.5 Exporting the Component
The App component is exported as the default export, allowing it to be imported and used in other parts of the application.
2.6 Rendering the chart
Overall, this code sets up a React application with a pie chart using Highcharts React. The data for the chart is defined in the grades array, and the chart’s configuration is specified in the options object. The chart is then rendered within the App component using the <PieChart> component provided by the Highcharts React library.
