Quarto Markdown: code & data

Code (4/7)

markup
qmd
quarto
python
Code on your Quarto web
Author

albertprofe

Published

Tuesday, June 1, 2021

Modified

Tuesday, September 26, 2023

Observable helps you use data to think.

Observable helps you explore and visualize data. It’s a platform to discover, to be inspired, and to accelerate your learning.

You can share your insights with the world. Above all, it’s a community of people helping each other learn and create together.

1 Observable JS

Link: A Taste of Observable

Quarto includes native support for Observable JS, a set of enhancements to vanilla JavaScript created by Mike Bostock (also the author of D3).

Observable JS is distinguished by its reactive runtime, which is especially well suited for interactive data exploration and analysis.

OJS code cells {ojs} behave a bit differently than cells in traditional notebooks, and have many options available to control their display and layout.

OJS code cells areCode blocks that use braces around the language name (e.g. ```{ojs}) are executable, and will be run by Quarto during render.

i = {
  let i = 0;
  while (true) {
    yield ++i;
  }
}

This is an exemple of running a script cell in Observable JS:

i
Tip

Add to this to the .qmd document to hide the code!

execute:
  echo: false

2 Data-source

There are a wide variety of way to make data available to OJS:

  • Read CSV, JSON, SQLite, and more using the FileAttachments API.
  • Use the ojs_define() function to make data processed in Python or R available to {ojs} cells.
  • Make calls to Web APIs for online services and data stores.

3 Examples: files, python and Rest

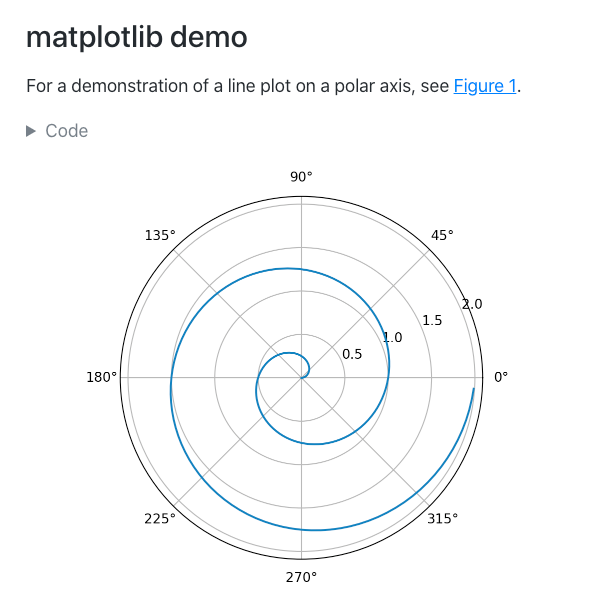
Code blocks that use braces around the language name (e.g. ```{python}) are executable, and will be run by Quarto during render.

Here is a simple example:

example-python-code
---
title: "matplotlib demo"
format:
  html:
    code-fold: true
jupyter: python3
---

For a demonstration of a line plot on a polar axis, see @fig-polar.
example-python-code

#| label: fig-polar
#| fig-cap: "A line plot on a polar axis"

import numpy as np
import matplotlib.pyplot as plt

r = np.arange(0, 2, 0.01)
theta = 2 * np.pi * r
fig, ax = plt.subplots(
  subplot_kw = {'projection': 'polar'} 
)
ax.plot(theta, r)
ax.set_rticks([0.5, 1, 1.5, 2])
ax.grid(True)
plt.show()

You’ll note that there are some special comments at the top of the code block. These are cell level options that make the figure cross-referenceable.

This document would result in the following rendered output:

python quarto following rendered output

python quarto following rendered output

We’ll explore all of these techniques below.

File Attachments Use the FileAttachment function from the standard library to read data from a file. For example, here we read and plot a CSV of NOAA’s Monthly CO2 concentration data from Mauna Loa:

data = {
  const co2data = await FileAttachment("co2_mm.csv")
    .csv({ typed: true } );
  return co2data.map(d => {
    d["decimal date"] = Number(d["decimal date"]);
    d.average = Number(d.average);
    return d;
  });
}
Plot.plot({
  marks: [
    Plot.line(data,
      { x: "decimal date", y: "average"},
      { stroke: "black" }
    )
  ]
})

Python and R The data you want to use with OJS might not always be available in raw form. Often you’ll need to read and preprocess the raw data using Python or R. You can perform this preprocessing during document render (in an {r} or {python} code cell) and then make it available to {ojs} cells via the ojs_define() function. Here’s an example. We’ll read the same data into R, do some grouping and summarization, then make it available to OJS using ojs_define:

#| output: false

library(readr)
library(dplyr)

co2 = read_csv("co2_mm.csv")  %>%
  group_by(year) %>%
  summarize(max = max(average))

ojs_define(co2data = co2)

Web APIs You can use the d3.json() function to read JSON data from web services and data sources. Here we query the GitHub API for data on contributions to the Python pandas package:

d3 = require('d3')

contributors = await d3.json(
  "https://api.github.com/repos/pandas-dev/pandas/stats/contributors"
)

commits = contributors.map(contributor => {
  const author = contributor.author;
  return {
    name: author.login,
    title: author.login,
    group: author.type,
    value: contributor.total
  }
})